December release
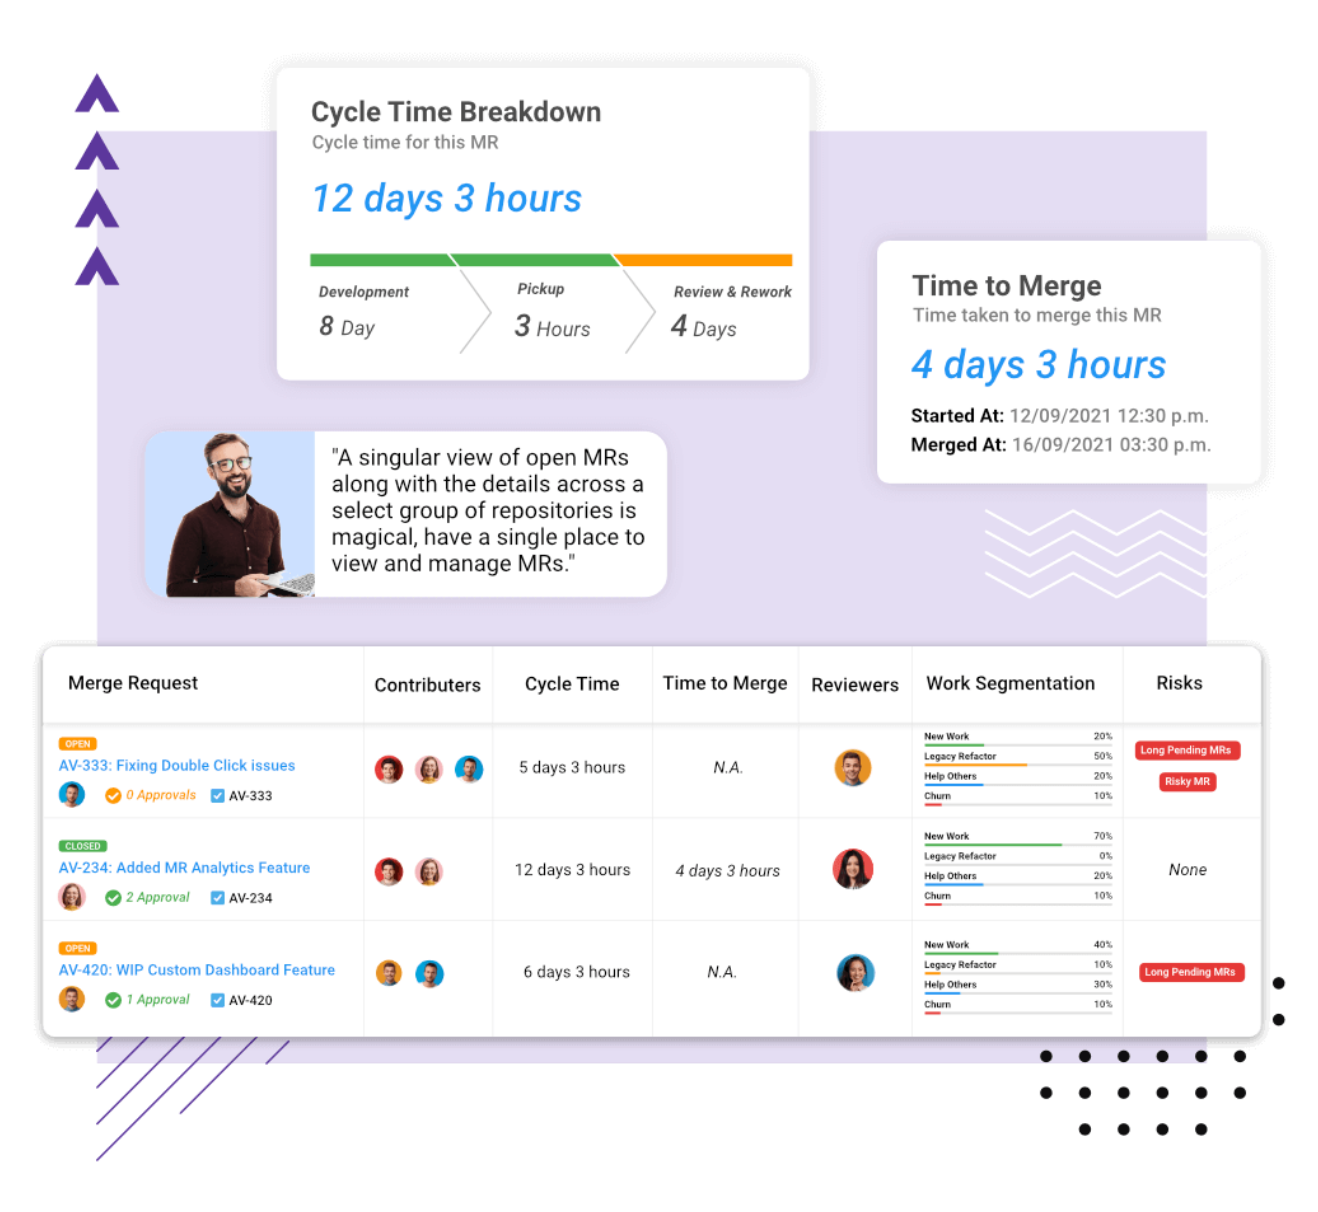
After the November release gave you the power to leverage MR Analytics to reduce bottlenecks, we thought if there were more ways to create such dashboards that can present specific, complete trend analyses.
Say, a dashboard for custom reports?
With graphs for the metrics, teams, projects, and timeframe that you specify?
We thought. And we made it.
And that’s what we present in this release.
Custom dashboard - with commit metrics
Feature-driven insights: Get the power of a BI tool without the hassle. Select what and whom to track. Create dashboard. That’s it. Get insights without having to define or compute anything. Sprint-wise, epic-wise, or in a custom time-frame, for specific projects or developers—view all graphs in detail.
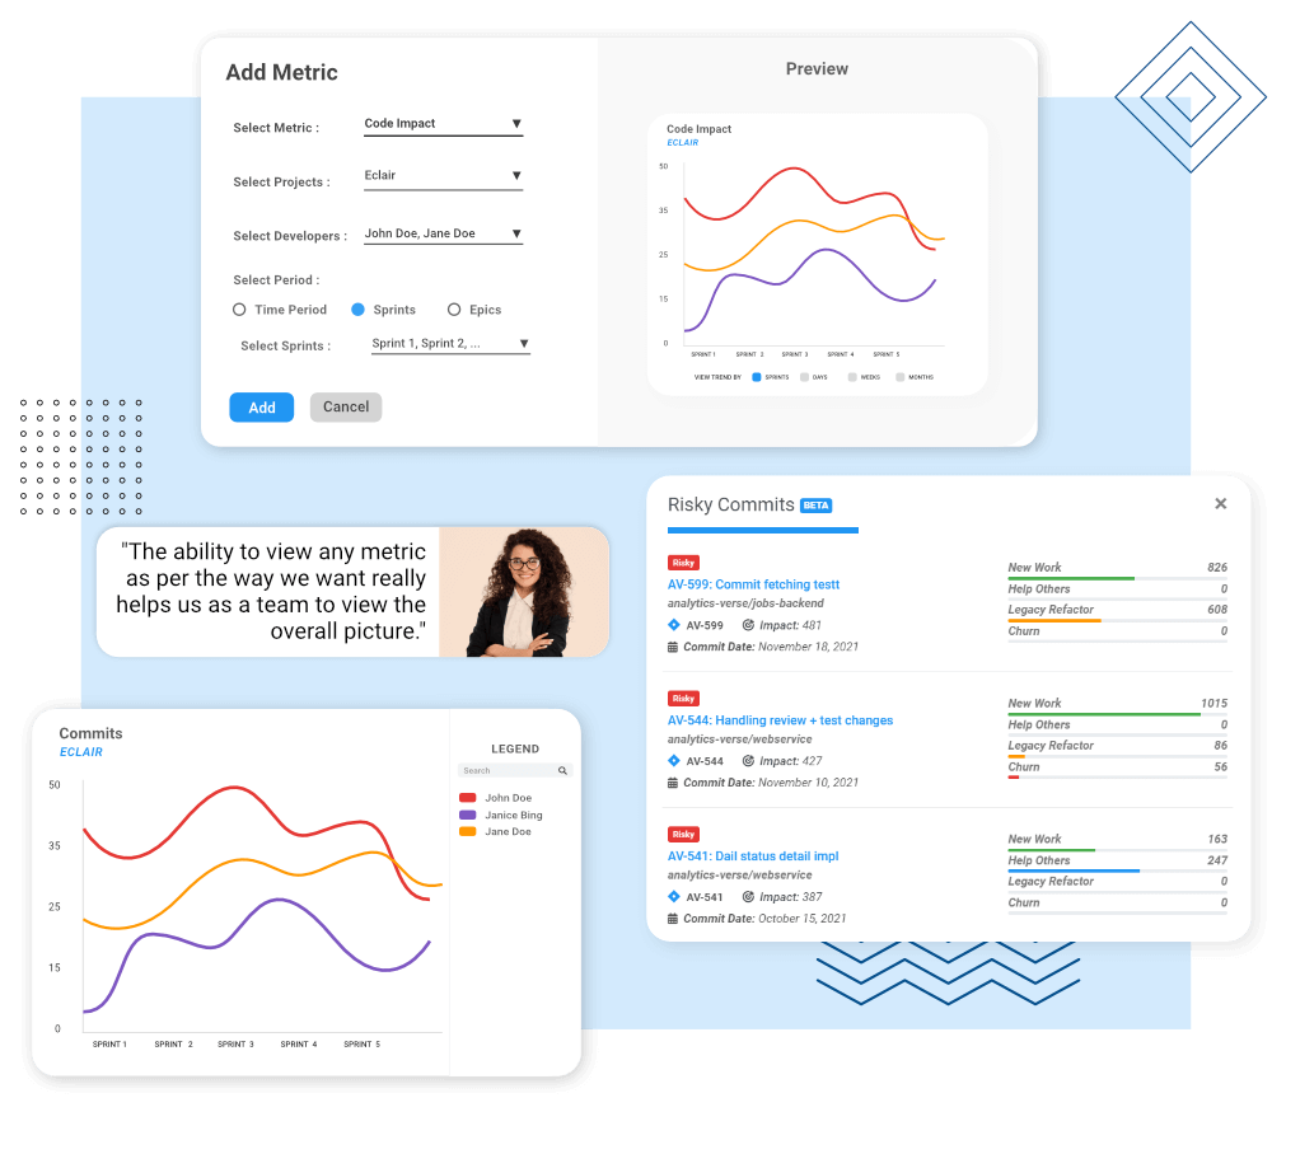
View graphs in each custom dashboard with corresponding details for each graph point
The metrics also include commit metrics, such as [example]
Custom dashboard, custom sharing: Share dashboards across teams, instantly.
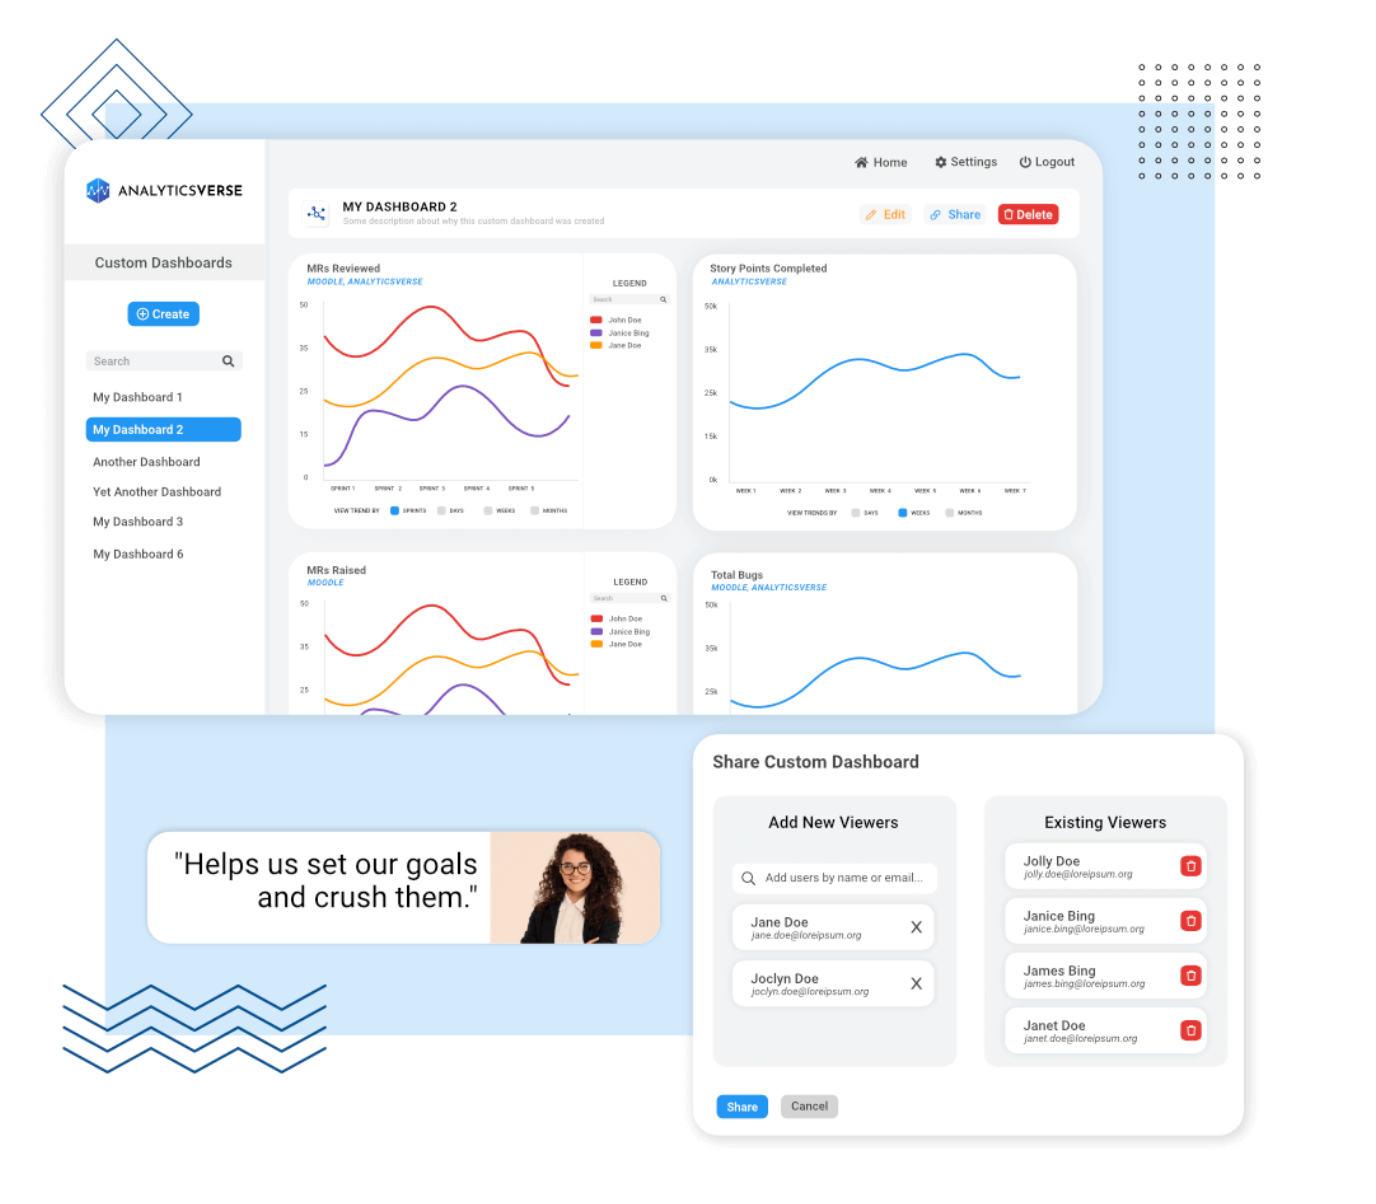
Granular control over sharing: Add or modify viewers separately
💡 Improvements 💡
- Fixed future sprints
- .eslintcache added to ignored files
🛠 Bug Fixes 🛠
Log4j fix
Optimised custom dashboard