January release
Is achieving speed and stability contradictory?
Turns out that they aren’t. We discovered that DORA’s research proves otherwise.
State of DevOps Report (2019) bucketed these four metrics that measure four aspects of software delivery performace—collectively referred to DORA metrics—into performance brackets, from ‘elite’ to ‘low’.
What we next wanted to discover, was what we can do to make AnalyticsVerse help you become an ‘elite performer’.
And in this release, we are glad to tell you that we actually can—by automating processes and tracking these metrics. Along with this, we add MR metrics to the custom dashboard that we introduced in the December release.
Read on.
📊 DORA metrics 📊
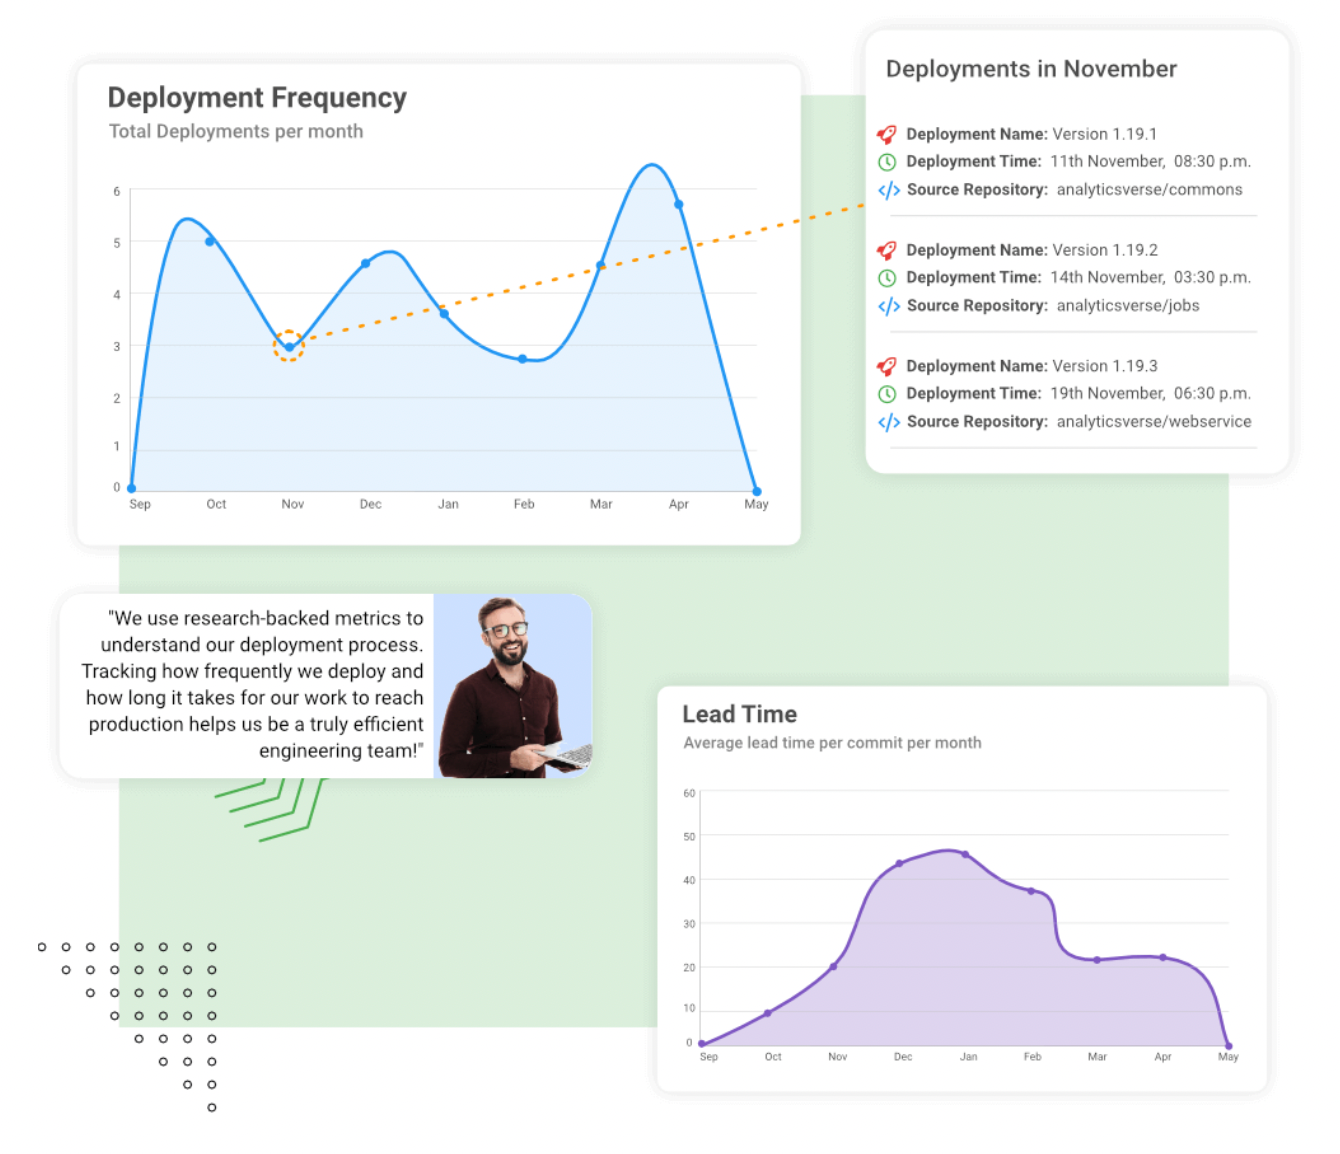
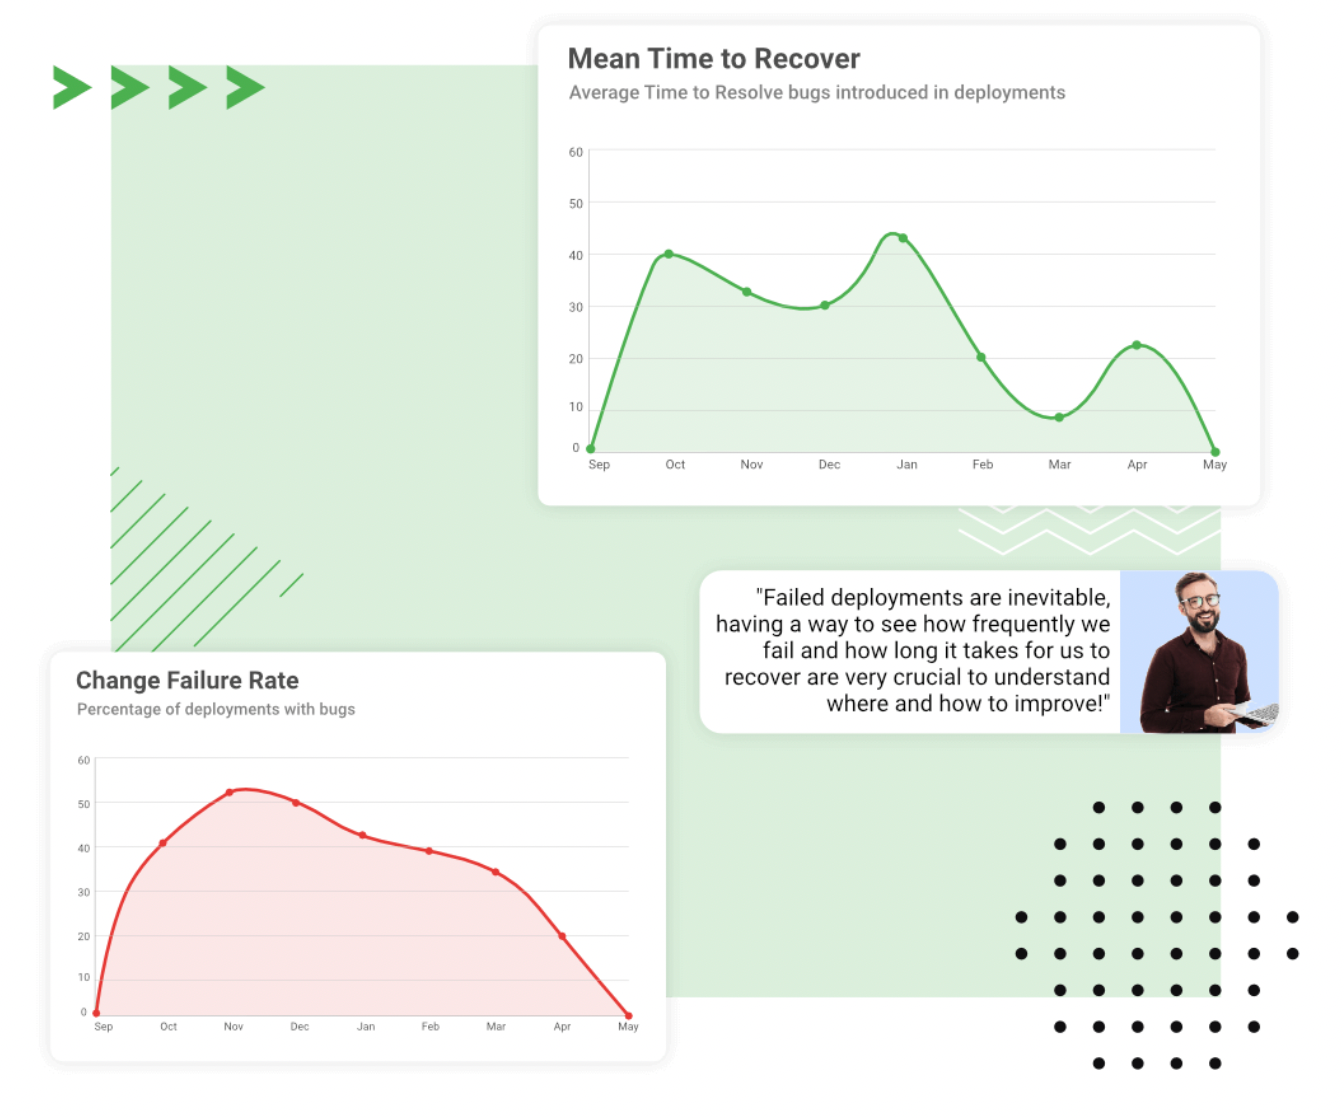
Deployment Frequency and Lead Time of Changes measure the speed of DevOps, and Change Failure Rate and Mean Time to Recovery measure stability.
Measure software delivery speed: Track project velocity by measuring deployment frequency and lead times for changes.
Objectively understand project stability and quality: How often are your deployments failing? How much time is failure recovery taking? Quantify your answers by tracking Change Failure Rate and Mean Time to Recover respectively.
Analyse the data from DORA metrics to improve upon the undesirable values.
👥 Specific views with Team Filter 👥
Some projects sometimes have the same set of repositories worked on by multiple teams simultaneously. With Team Filter, you can view data across dashboards for specific member combinations.
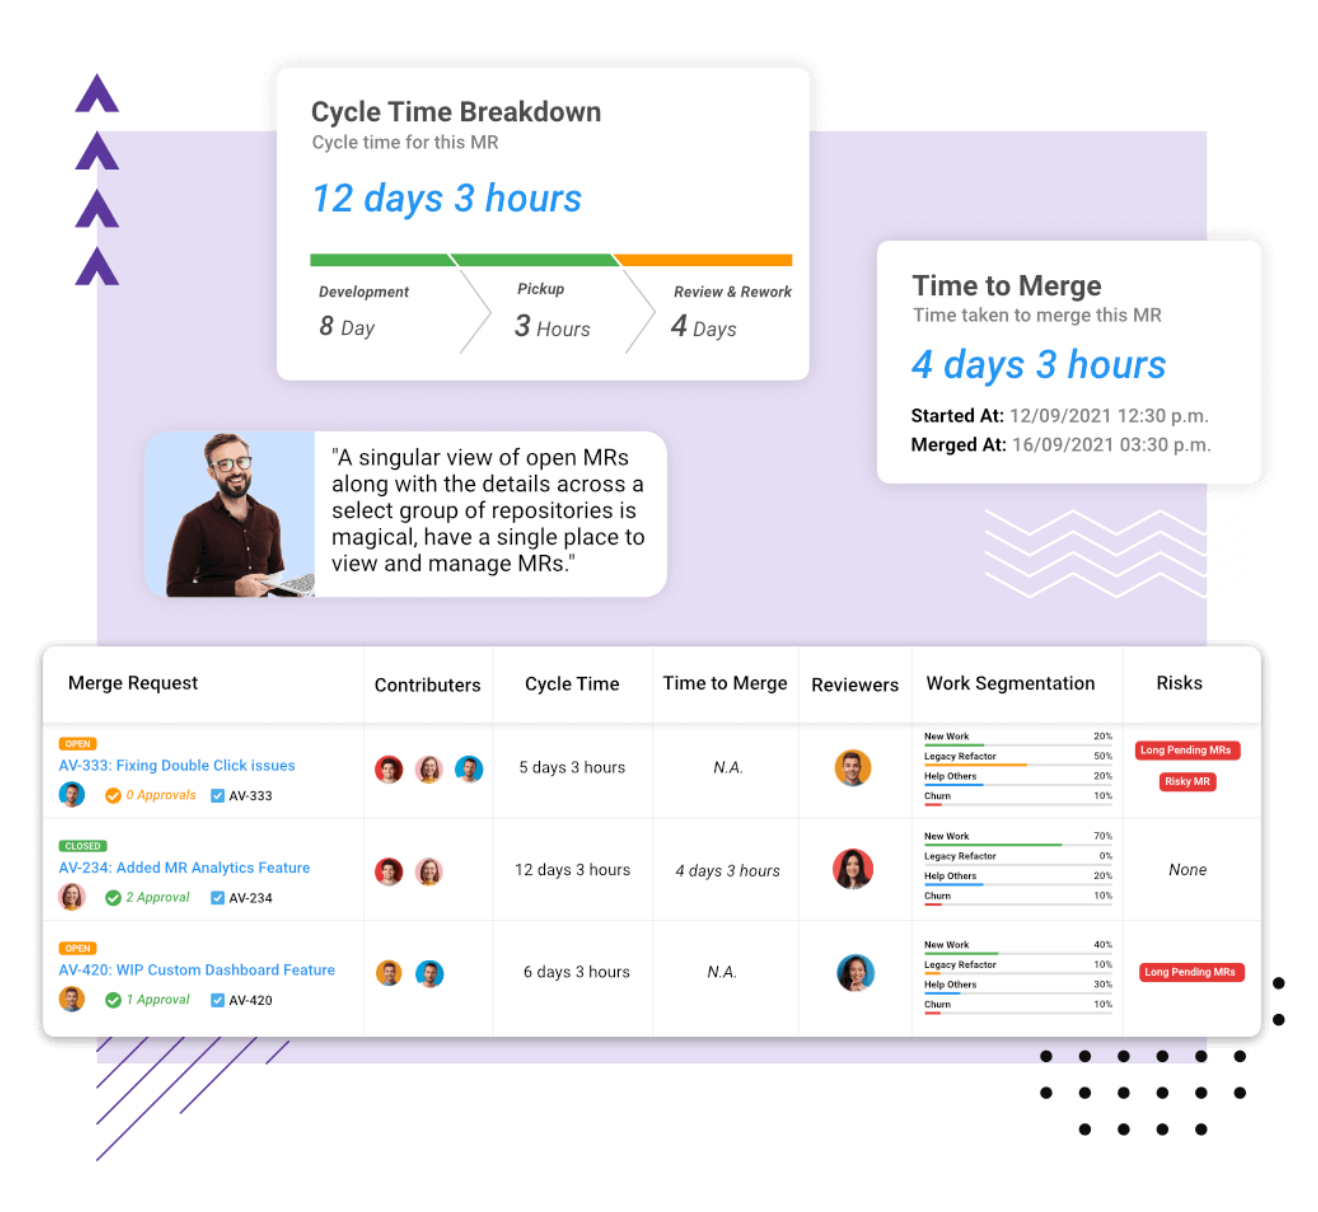
📌 MR metrics in custom dashboard 📌
You can now view detailed graphs for metric like [MR metrics example] in the custom dashboards.
💡 Improvements 💡
- Detected epic deletion
- Commit deletion
- Updated subtasks when tasks are updated
- Mismatch alerts
🛠 Bug Fixes 🛠
Fixed burndown chart negative
Security header fixes
Developer dashboard fixes